
Bar Graphs
Bar Graphs: Overview
This Topic covers sub-topics such as Bar Graphs, Representation of Data, Proper Scale for Plotting Bar Graphs, Drawing Double Bar Graphs and, Double Bar Graph for Data Having Two Types
Important Questions on Bar Graphs
Draw a double bar graph to compare the data in the given table:
Enrolment in computer courses
| Year/Course | Basic | Logo | Computer Science | Using Software |
| Year One | ||||
| Year Two |
From the following table which shows marks obtained by students in maths class test, draw a bar graph.
| Marks | |||||||
| Number of students |
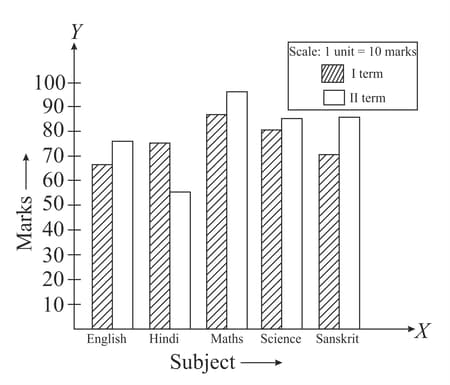
The following dual bar graph represents performance of Prateeksha in term and term. In which subject the highest marks are scored in term ?
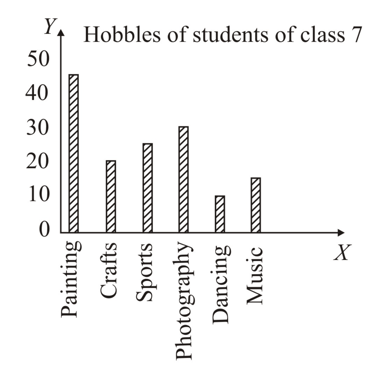
How many more students enjoy photography as compared to crafts?
The graph that is drawn to compare two quantities having the same units is:
In a bar graph, length of a bar represents people. What is the length of the bar which represents people?
Construct a histogram for the following distribution.
| Class-intervals | Frequency |
A bar graph is drawn to the scale , then a bar of length represents
Draw bar graph using the data given in the following table, which shows the number of bikes manufactured in a factory during the years to
| Year | Number of bikes |


